Analyzing reactivity {🚀}
Using trace for debugging
Trace is a small utility that helps you find out why your computed values, reactions or components are re-evaluating.
It can be used by simply importing import { trace } from "mobx", and then putting it inside a reaction or computed value.
It will print why it is re-evaluating the current derivation.
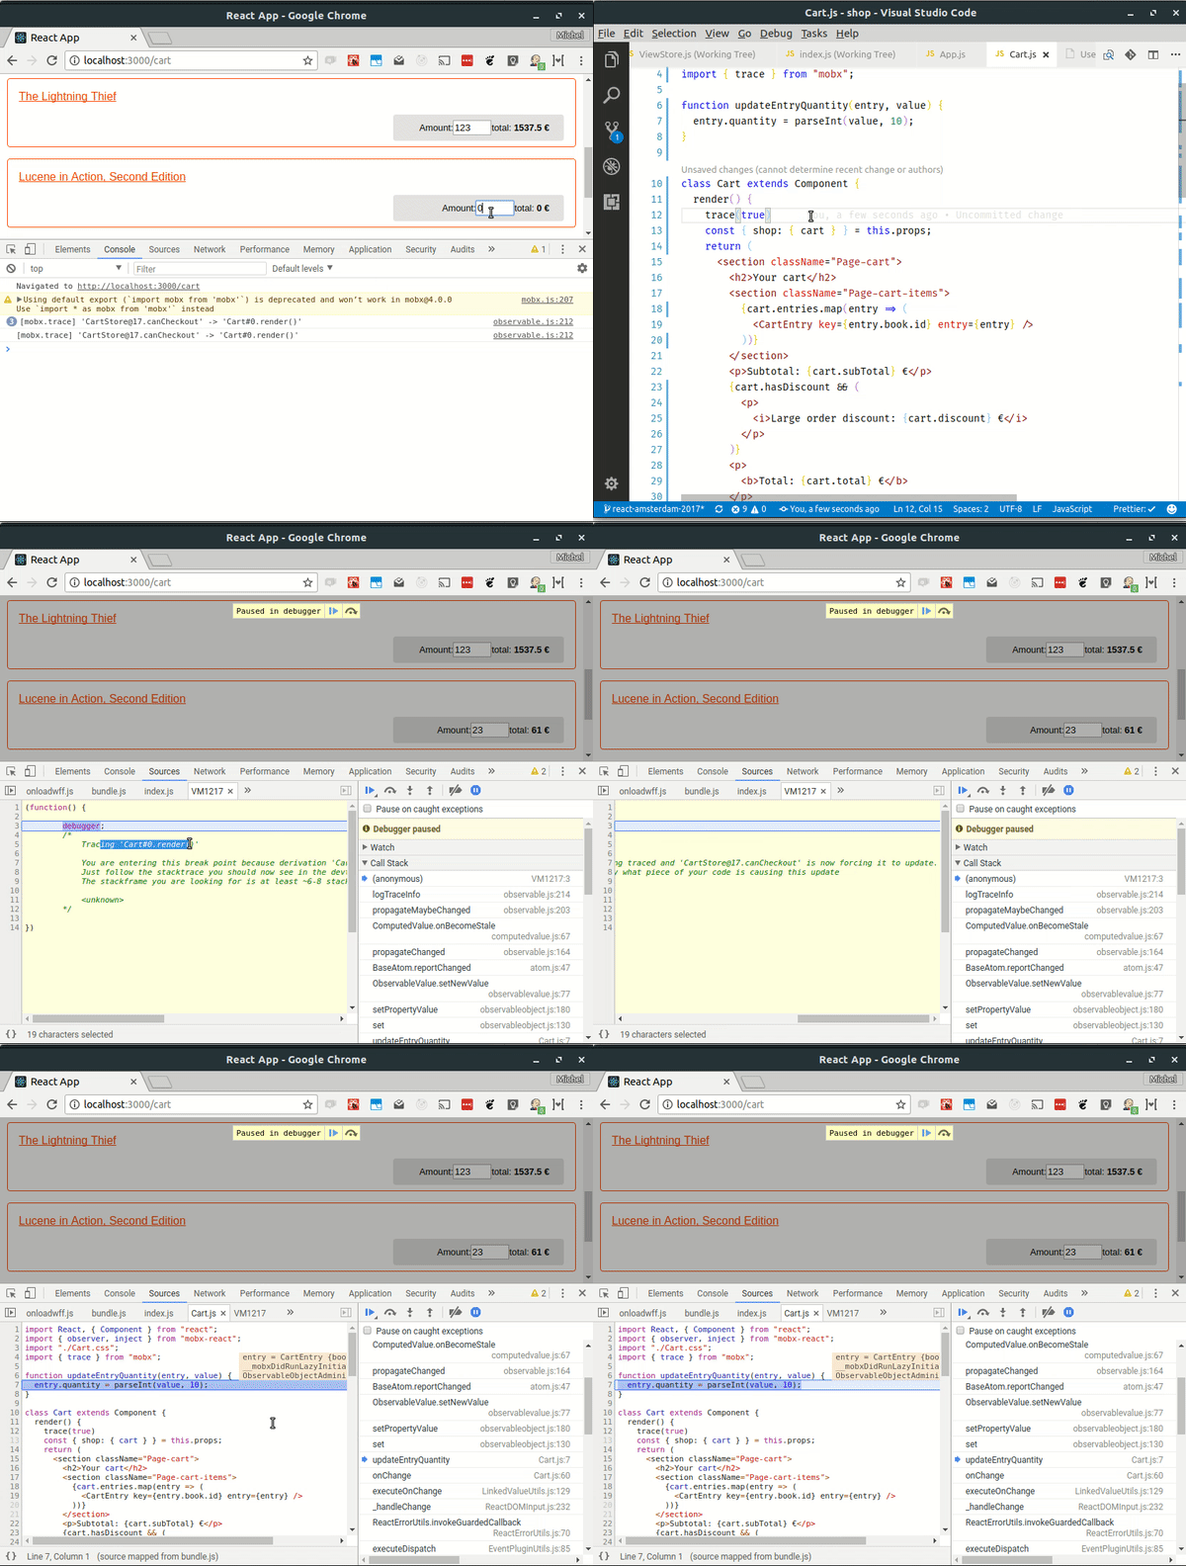
Optionally it is possible to automatically enter the debugger by passing true as the last argument.
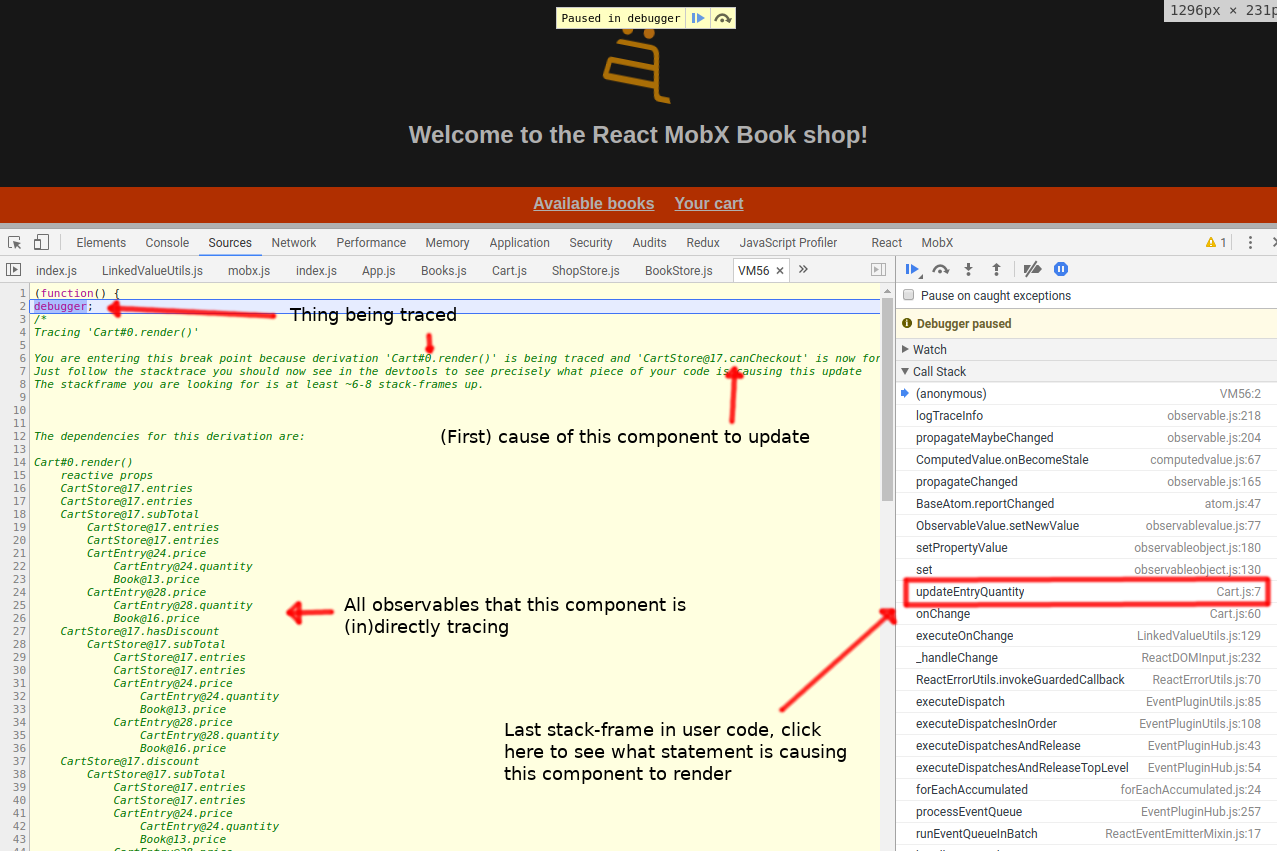
This way the exact mutation that causes the reaction to re-run will still be in stack, usually ~8 stack frames up. See the image below.
In debugger mode, the debug information will also reveal the full derivation tree that is affecting the current computation / reaction.


Live examples
Simple CodeSandbox trace example.
Here's a deployed example for exploring the stack. Make sure to play with the chrome debugger's blackbox feature!
Usage examples
There are different ways of calling trace(), some examples:
import { observer } from "mobx-react"
import { trace } from "mobx"

const MyComponent = observer(() => {
    trace(true) // Enter the debugger whenever an observable value causes this component to re-run.
    return <div>{this.props.user.name}</name>
})
Enable trace by using the reaction argument of a reaction / autorun:
mobx.autorun("logger", reaction => {
    reaction.trace()
    console.log(user.fullname)
})
Pass in the property name of a computed property:
trace(user, "fullname")
Introspection APIs
The following APIs might come in handy if you want to inspect the internal state of MobX while debugging, or want to build cool tools on top of MobX.
Also relevant are the various isObservable* APIs.
getDebugName
Usage:
getDebugName(thing, property?)
Returns a (generated) friendly debug name of an observable object, property, reaction etc. Used for example by the MobX developer tools.
getDependencyTree
Usage:
getDependencyTree(thing, property?).
Returns a tree structure with all observables the given reaction / computation currently depends upon.
getObserverTree
Usage:
getObserverTree(thing, property?).
Returns a tree structure with all reactions / computations that are observing the given observable.
getAtom
Usage:
getAtom(thing, property?).
Returns the backing Atom of a given observable object, property, reaction etc.
Spy
Usage:
spy(listener)
Registers a global spy listener that listens to all events that happen in MobX.
It is similar to attaching an observe listener to all observables at once, but also notifies about running (trans/re)actions and computations.
Used for example by the MobX developer tools.
Example usage of spying all actions:
spy(event => {
    if (event.type === "action") {
        console.log(`${event.name} with args: ${event.arguments}`)
    }
})
Spy listeners always receive one object, which usually has at least a type field. The following events are emitted by default by spy:
| Type | observableKind | Other fields | Nested |
|---|---|---|---|
| action | name, object (scope), arguments[] | yes | |
| scheduled-reaction | name | no | |
| reaction | name | yes | |
| error | name, message, error | no | |
| add,update,remove,delete,splice | Check out Intercept & observe {🚀} | yes | |
| report-end | spyReportEnd=true, time? (total execution time in ms) | no |
The report-end events are part of an earlier fired event that had spyReportStart: true.
This event indicates the end of an event and this way groups of events with sub-events are created.
This event might report the total execution time as well.
The spy events for observable values are identical to the events passed to observe.
In production builds, the spy API is a no-op as it will be minimized away.
Check out the Intercept & observe {🚀} section for an extensive overview.
